Case study · Client name withheld
Home Blood Pressure Monitoring App
A Flutter app that pairs with Bluetooth home devices and uploads readings to the client's service
An app that lets patients send readings from Bluetooth home devices to the client's service. Patients sign in, scan and pair a Bluetooth blood-pressure monitor and a Bluetooth scale, take readings, and see their history and blood-pressure charts. Our team built the Flutter app, published on Google Play and the App Store.
- Client
- Confidential client · Health
- Platforms
- iOS · Android
- Our scope
- Flutter app · Bluetooth integration · Uploads
- Period
- 2026
The product
What it does, and for whom
The hard part of a connected-device app is what the device does between the button press and the upload. Here, the monitor sends its readings only after it receives a Set Time command, so the app has to synchronise the device's time first and then handle the Bluetooth indications that carry the readings. The app also removes duplicate readings by device, timestamp and values, and retries failed uploads.
Scope: The back end and API are the client's service, and the monitor and scale are third-party devices; we did not make them or their firmware. Our work was the mobile app, including its Bluetooth integration. The monitor and scale are not pictured on this page.
Our contribution
What our team built
Flutter app
Patient sign-in, device scanning and pairing, readings, reading history and blood-pressure charts, in Flutter with native Kotlin and Swift integration. Built with fl_chart and flutter_secure_storage.
Bluetooth integration
Scanning, pairing and readings over Bluetooth Low Energy with flutter_blue_plus: device time synchronisation and handling of Bluetooth indications.
Uploads
Uploading readings to the client's service through its API with Dio, de-duplicating by device, timestamp and values, and retrying failed uploads.
Technologies: Flutter · Kotlin · Swift · Bluetooth Low Energy · flutter_blue_plus · Dio · flutter_secure_storage · fl_chart
User flow
From device to chart
Four screens that follow a reading from the home device to the patient's history.
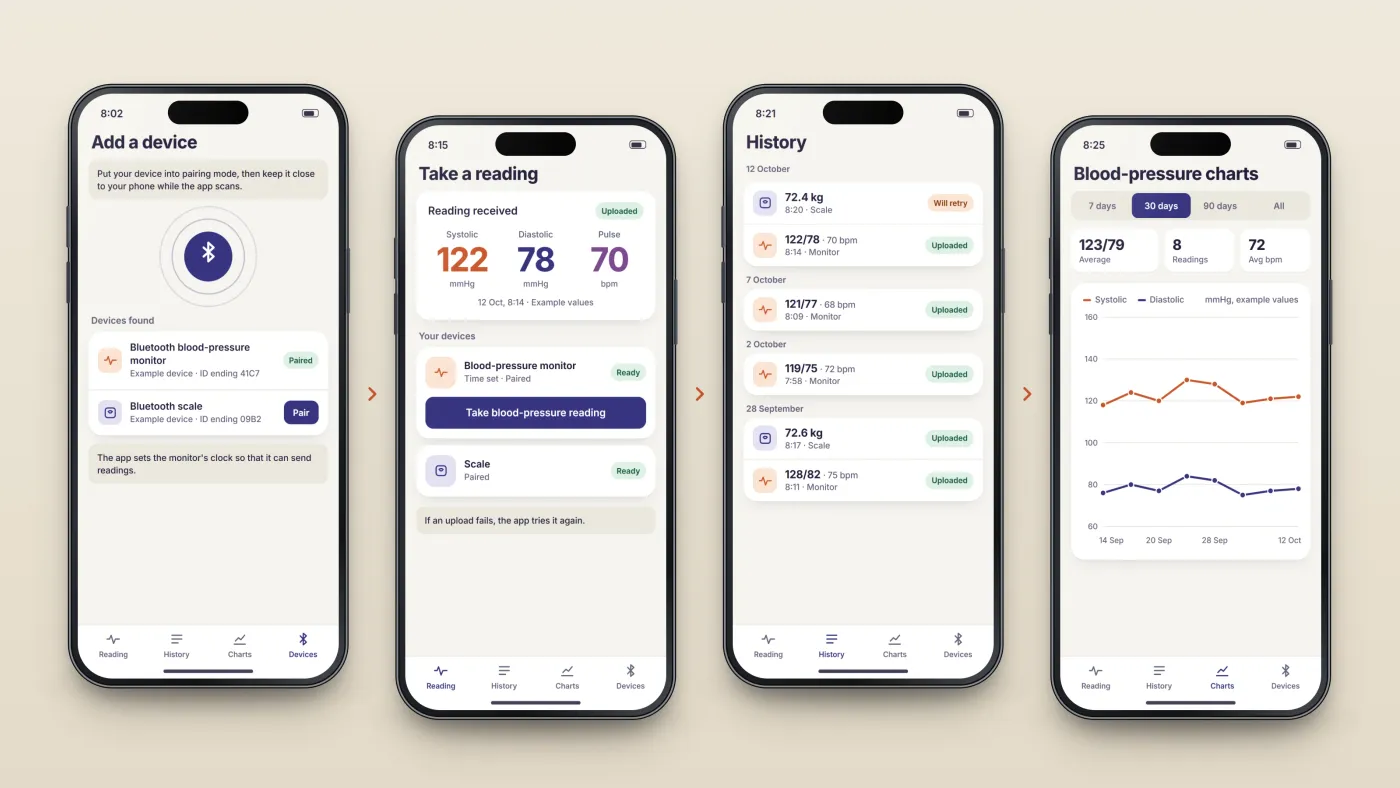
Pair a device
Scan for a Bluetooth monitor or scale, then pair it.
Take a reading
The app sets the monitor's time, receives the reading and uploads it.
See the history
Readings are listed for the patient to look back on.
Follow the charts
Blood-pressure readings are plotted over time.
The product in use
Inside the app
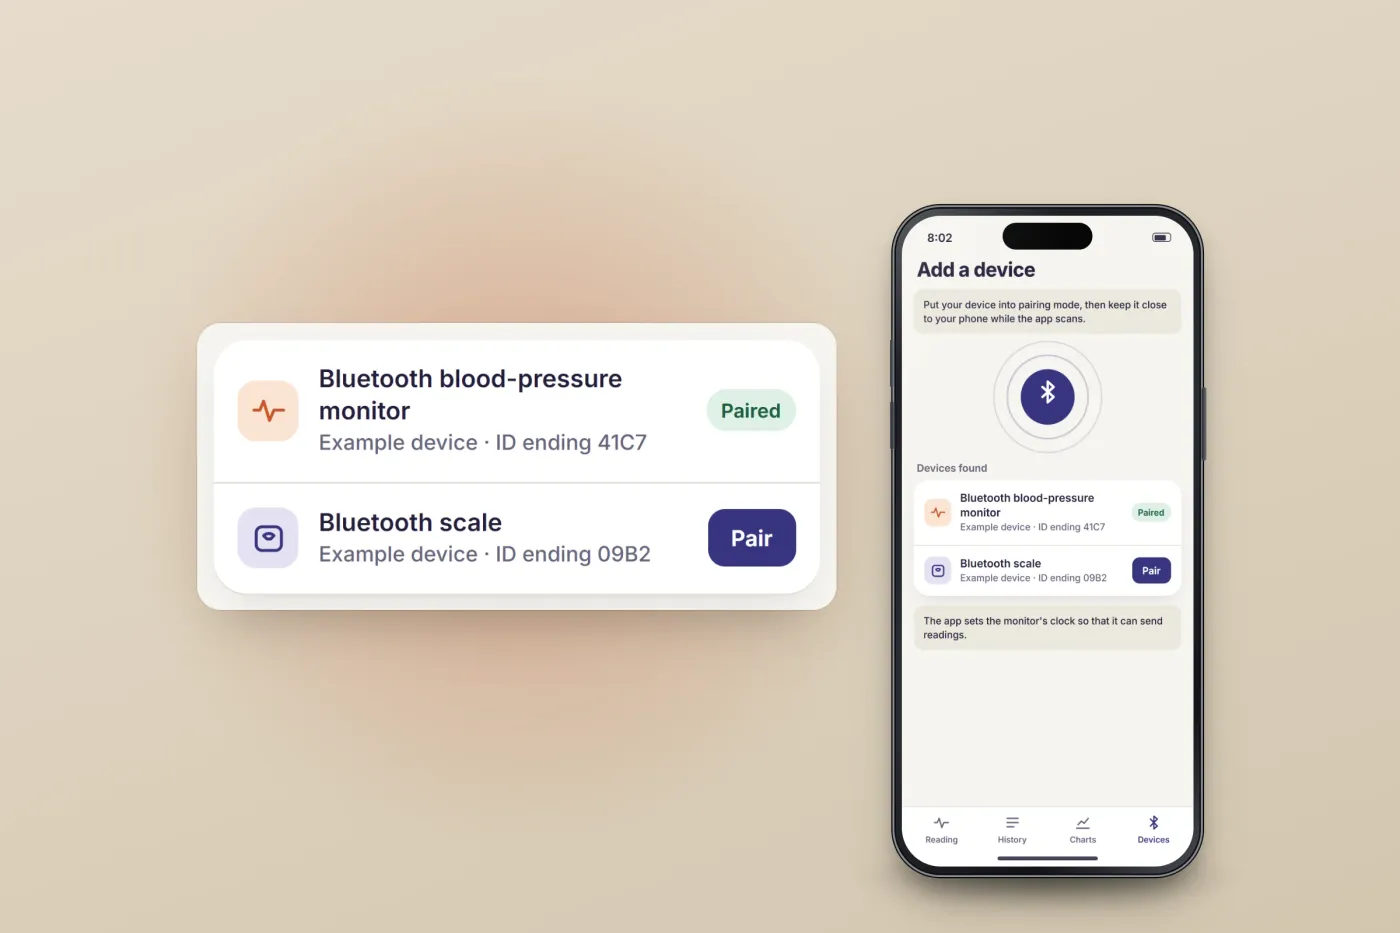
Scanning and pairing
The app scans for Bluetooth home devices and pairs a blood-pressure monitor and a scale.
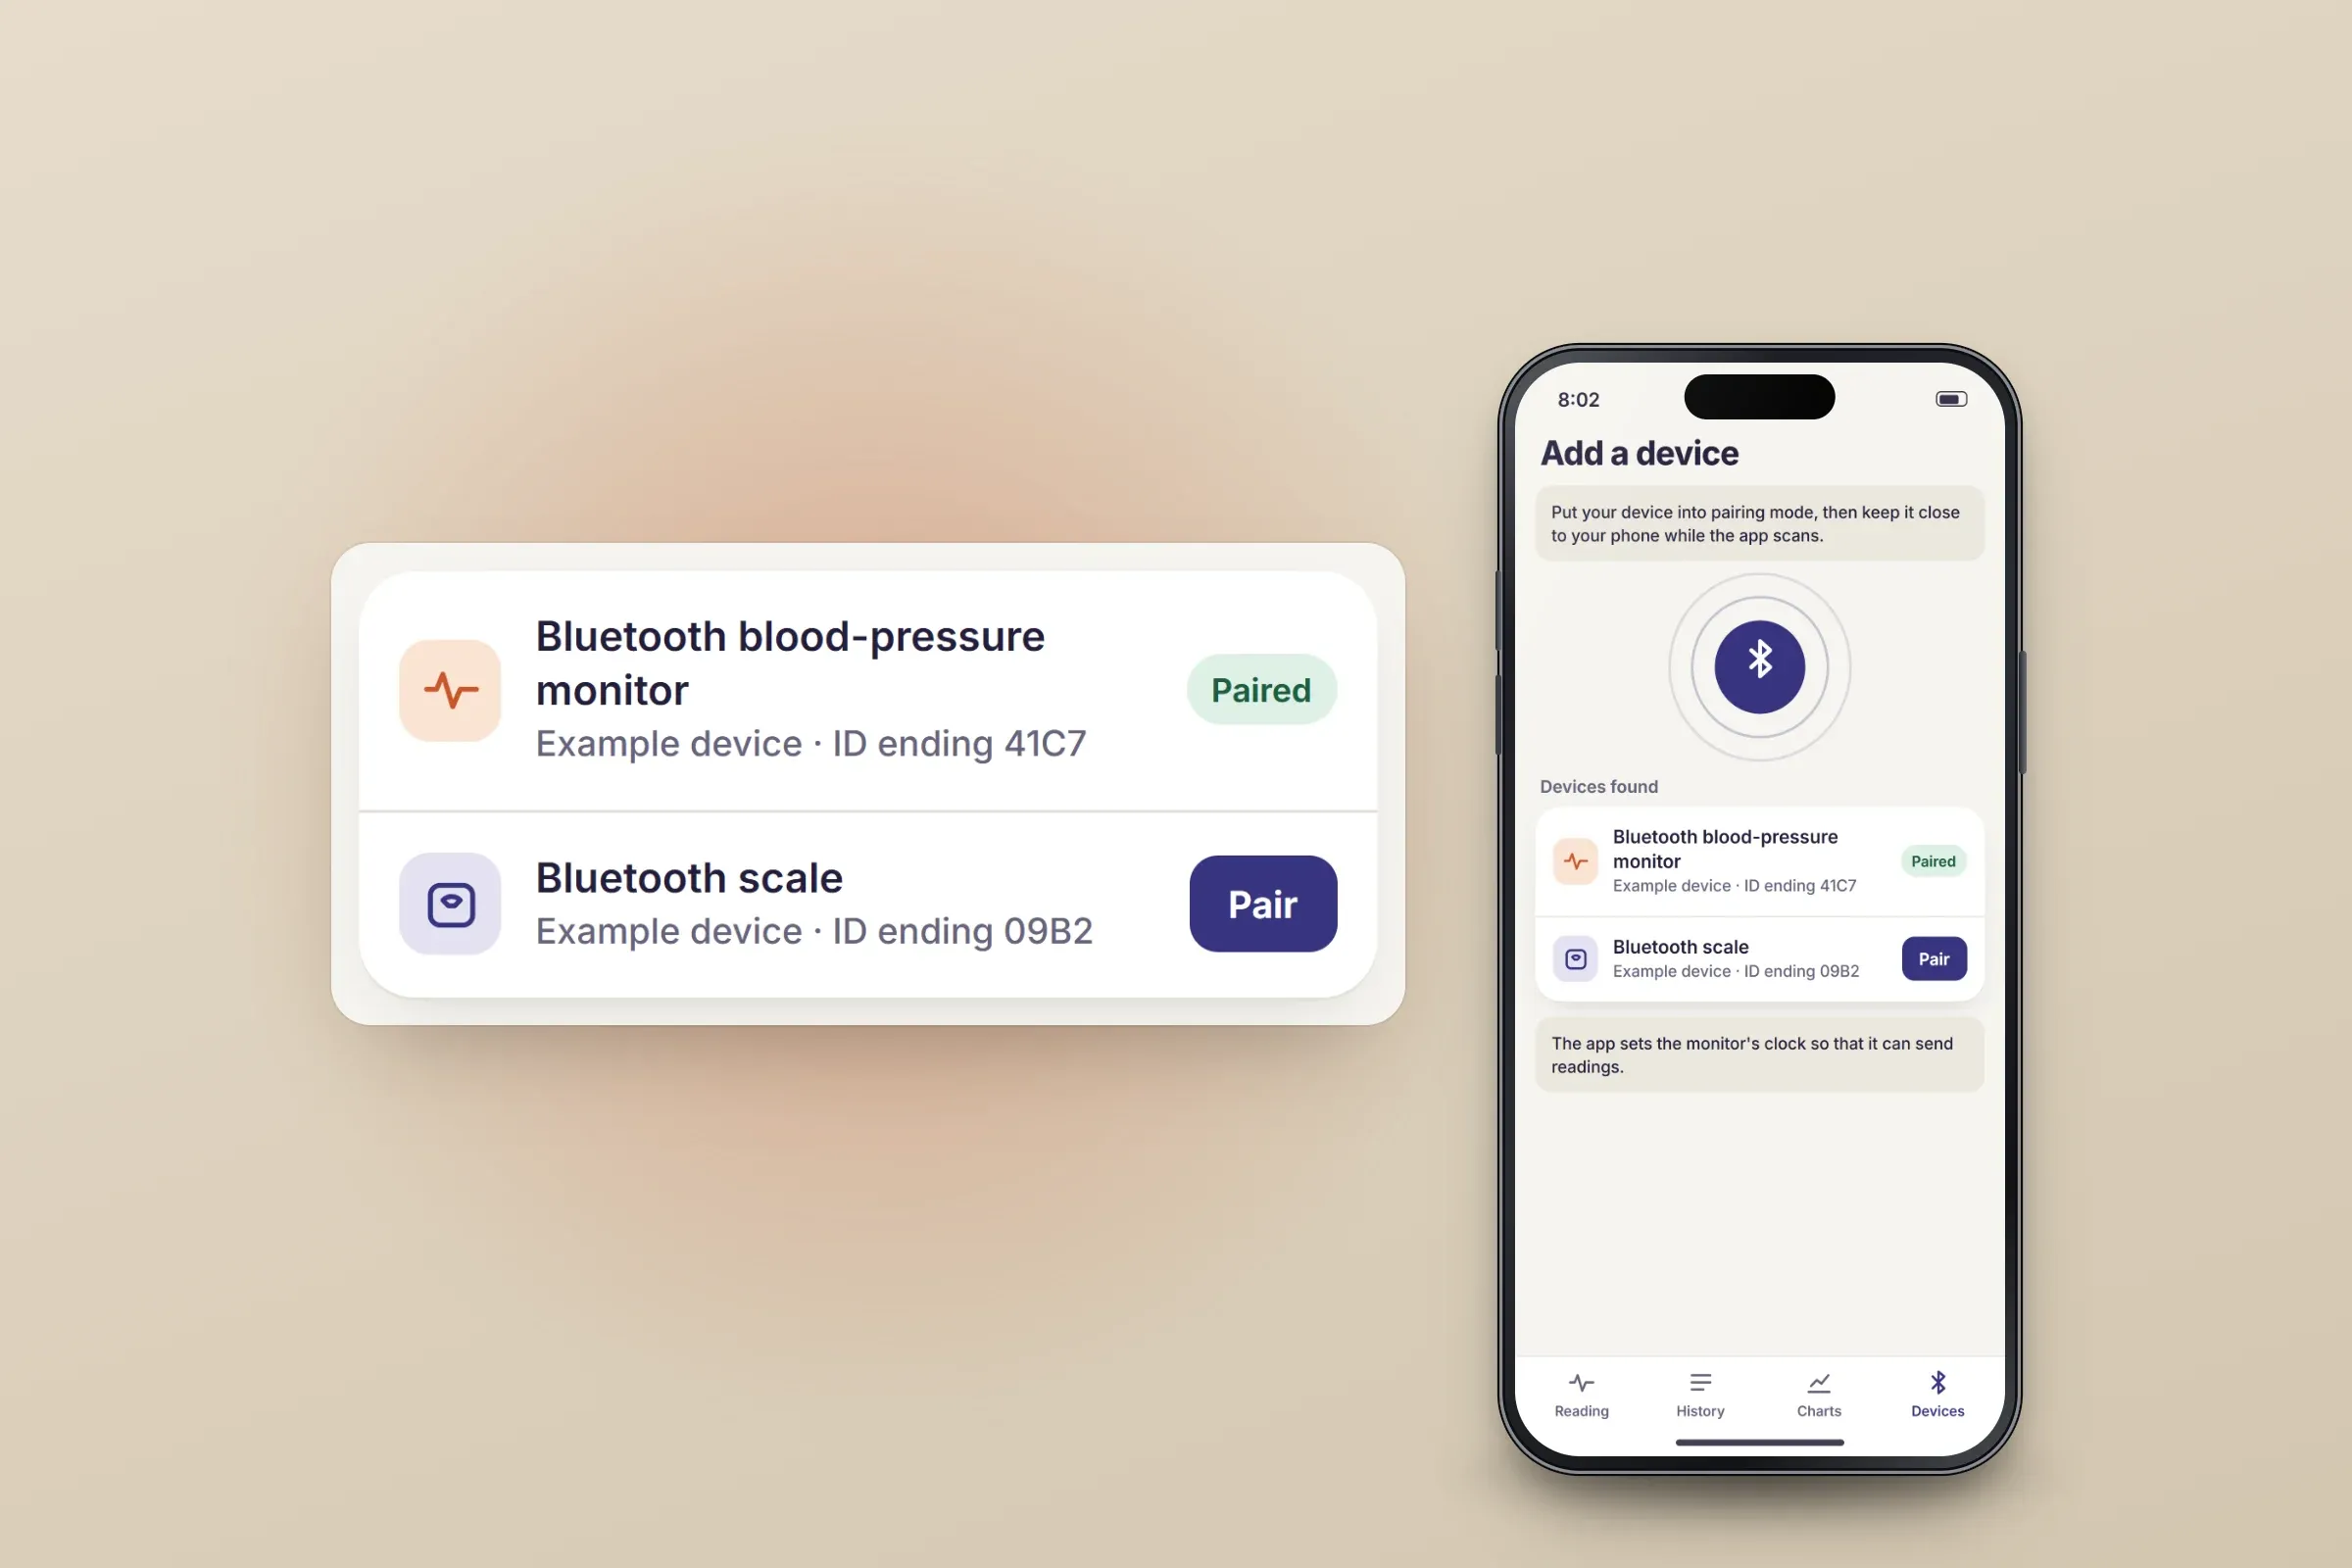
Scan and pair. Close-ups on phones: tap any image for the full screen. Time sync, then the reading
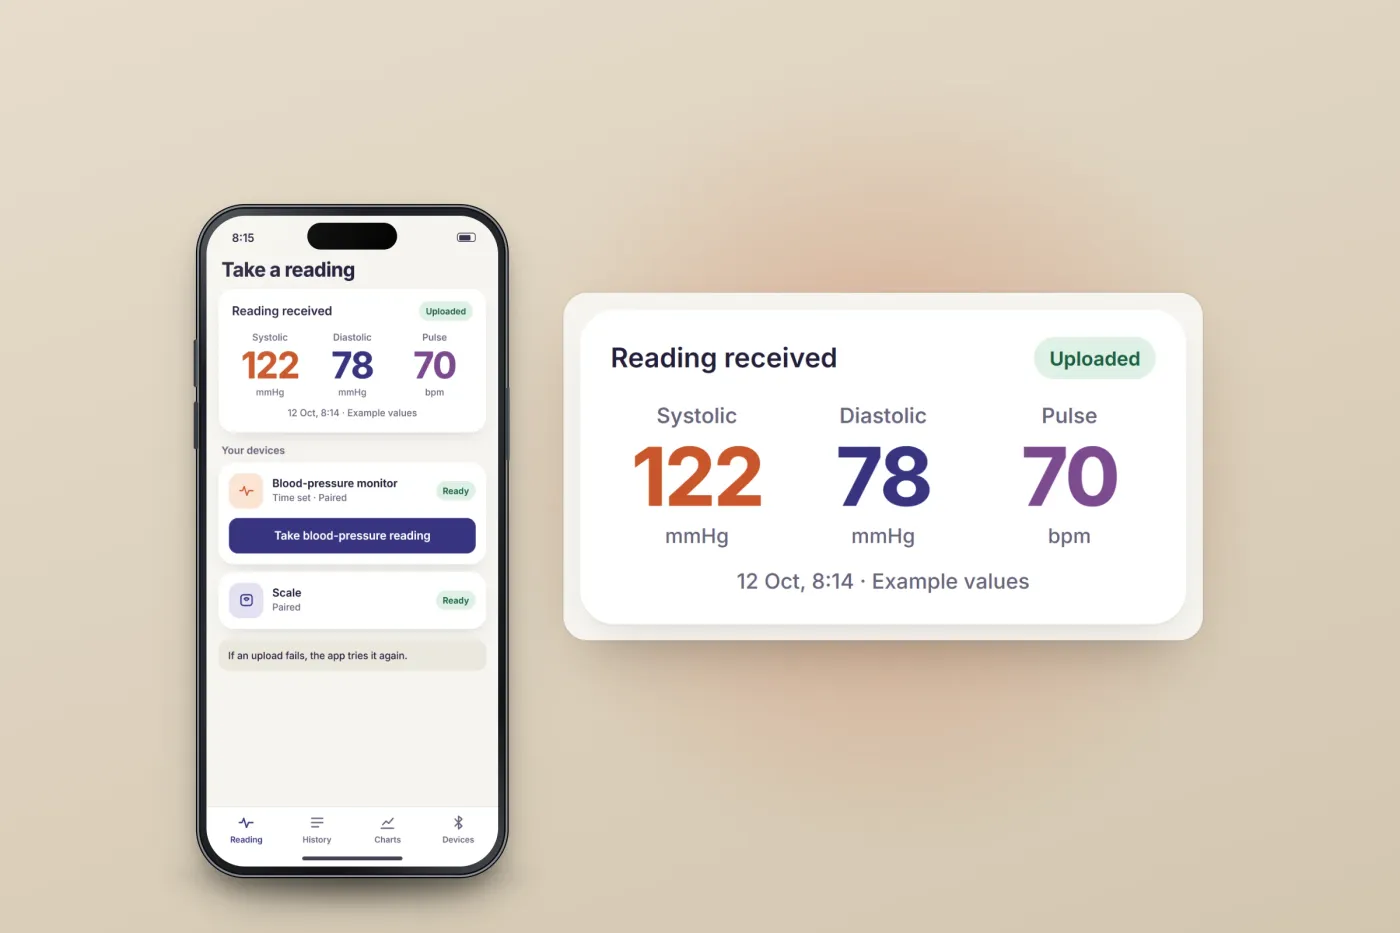
Because the monitor sends readings only after a Set Time command, the app synchronises the device's time and listens for Bluetooth indications. The reading then appears on screen and goes to the client's service through its API.
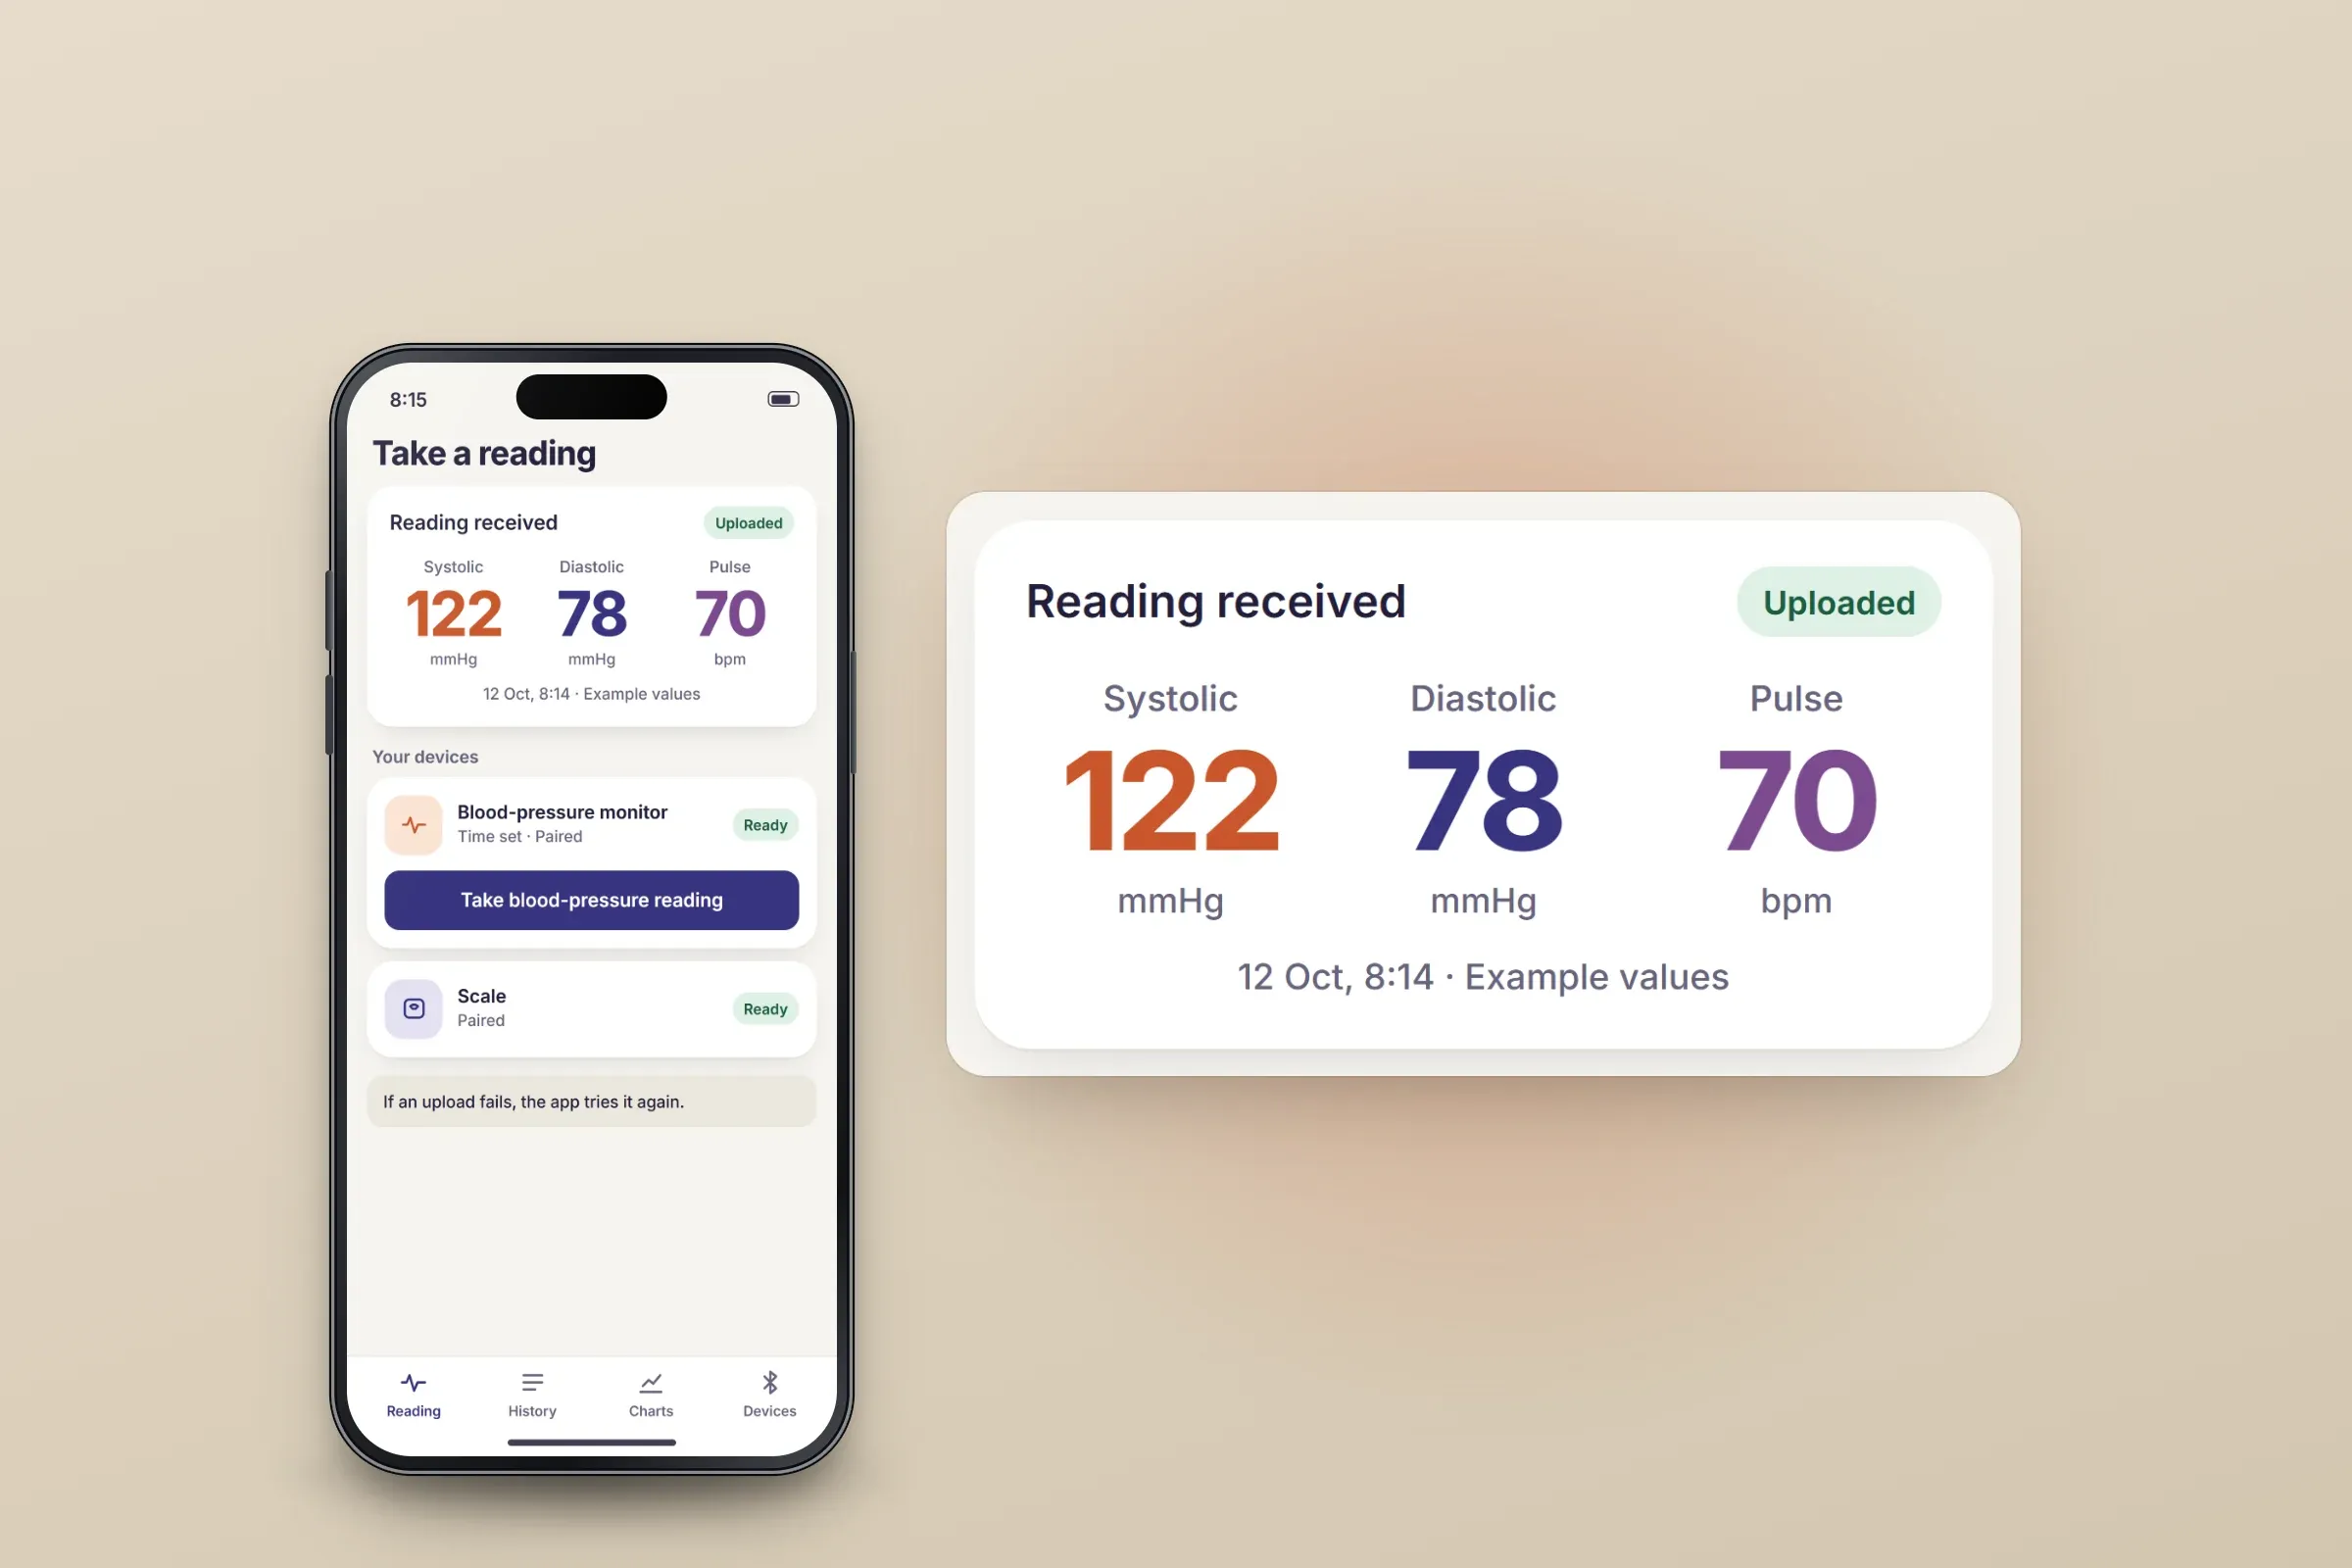
A received reading. Close-ups on phones: tap any image for the full screen. History, de-duplication and retries
The reading history lists a patient's readings. Behind it, duplicates are removed by device, timestamp and values, and failed uploads are retried.
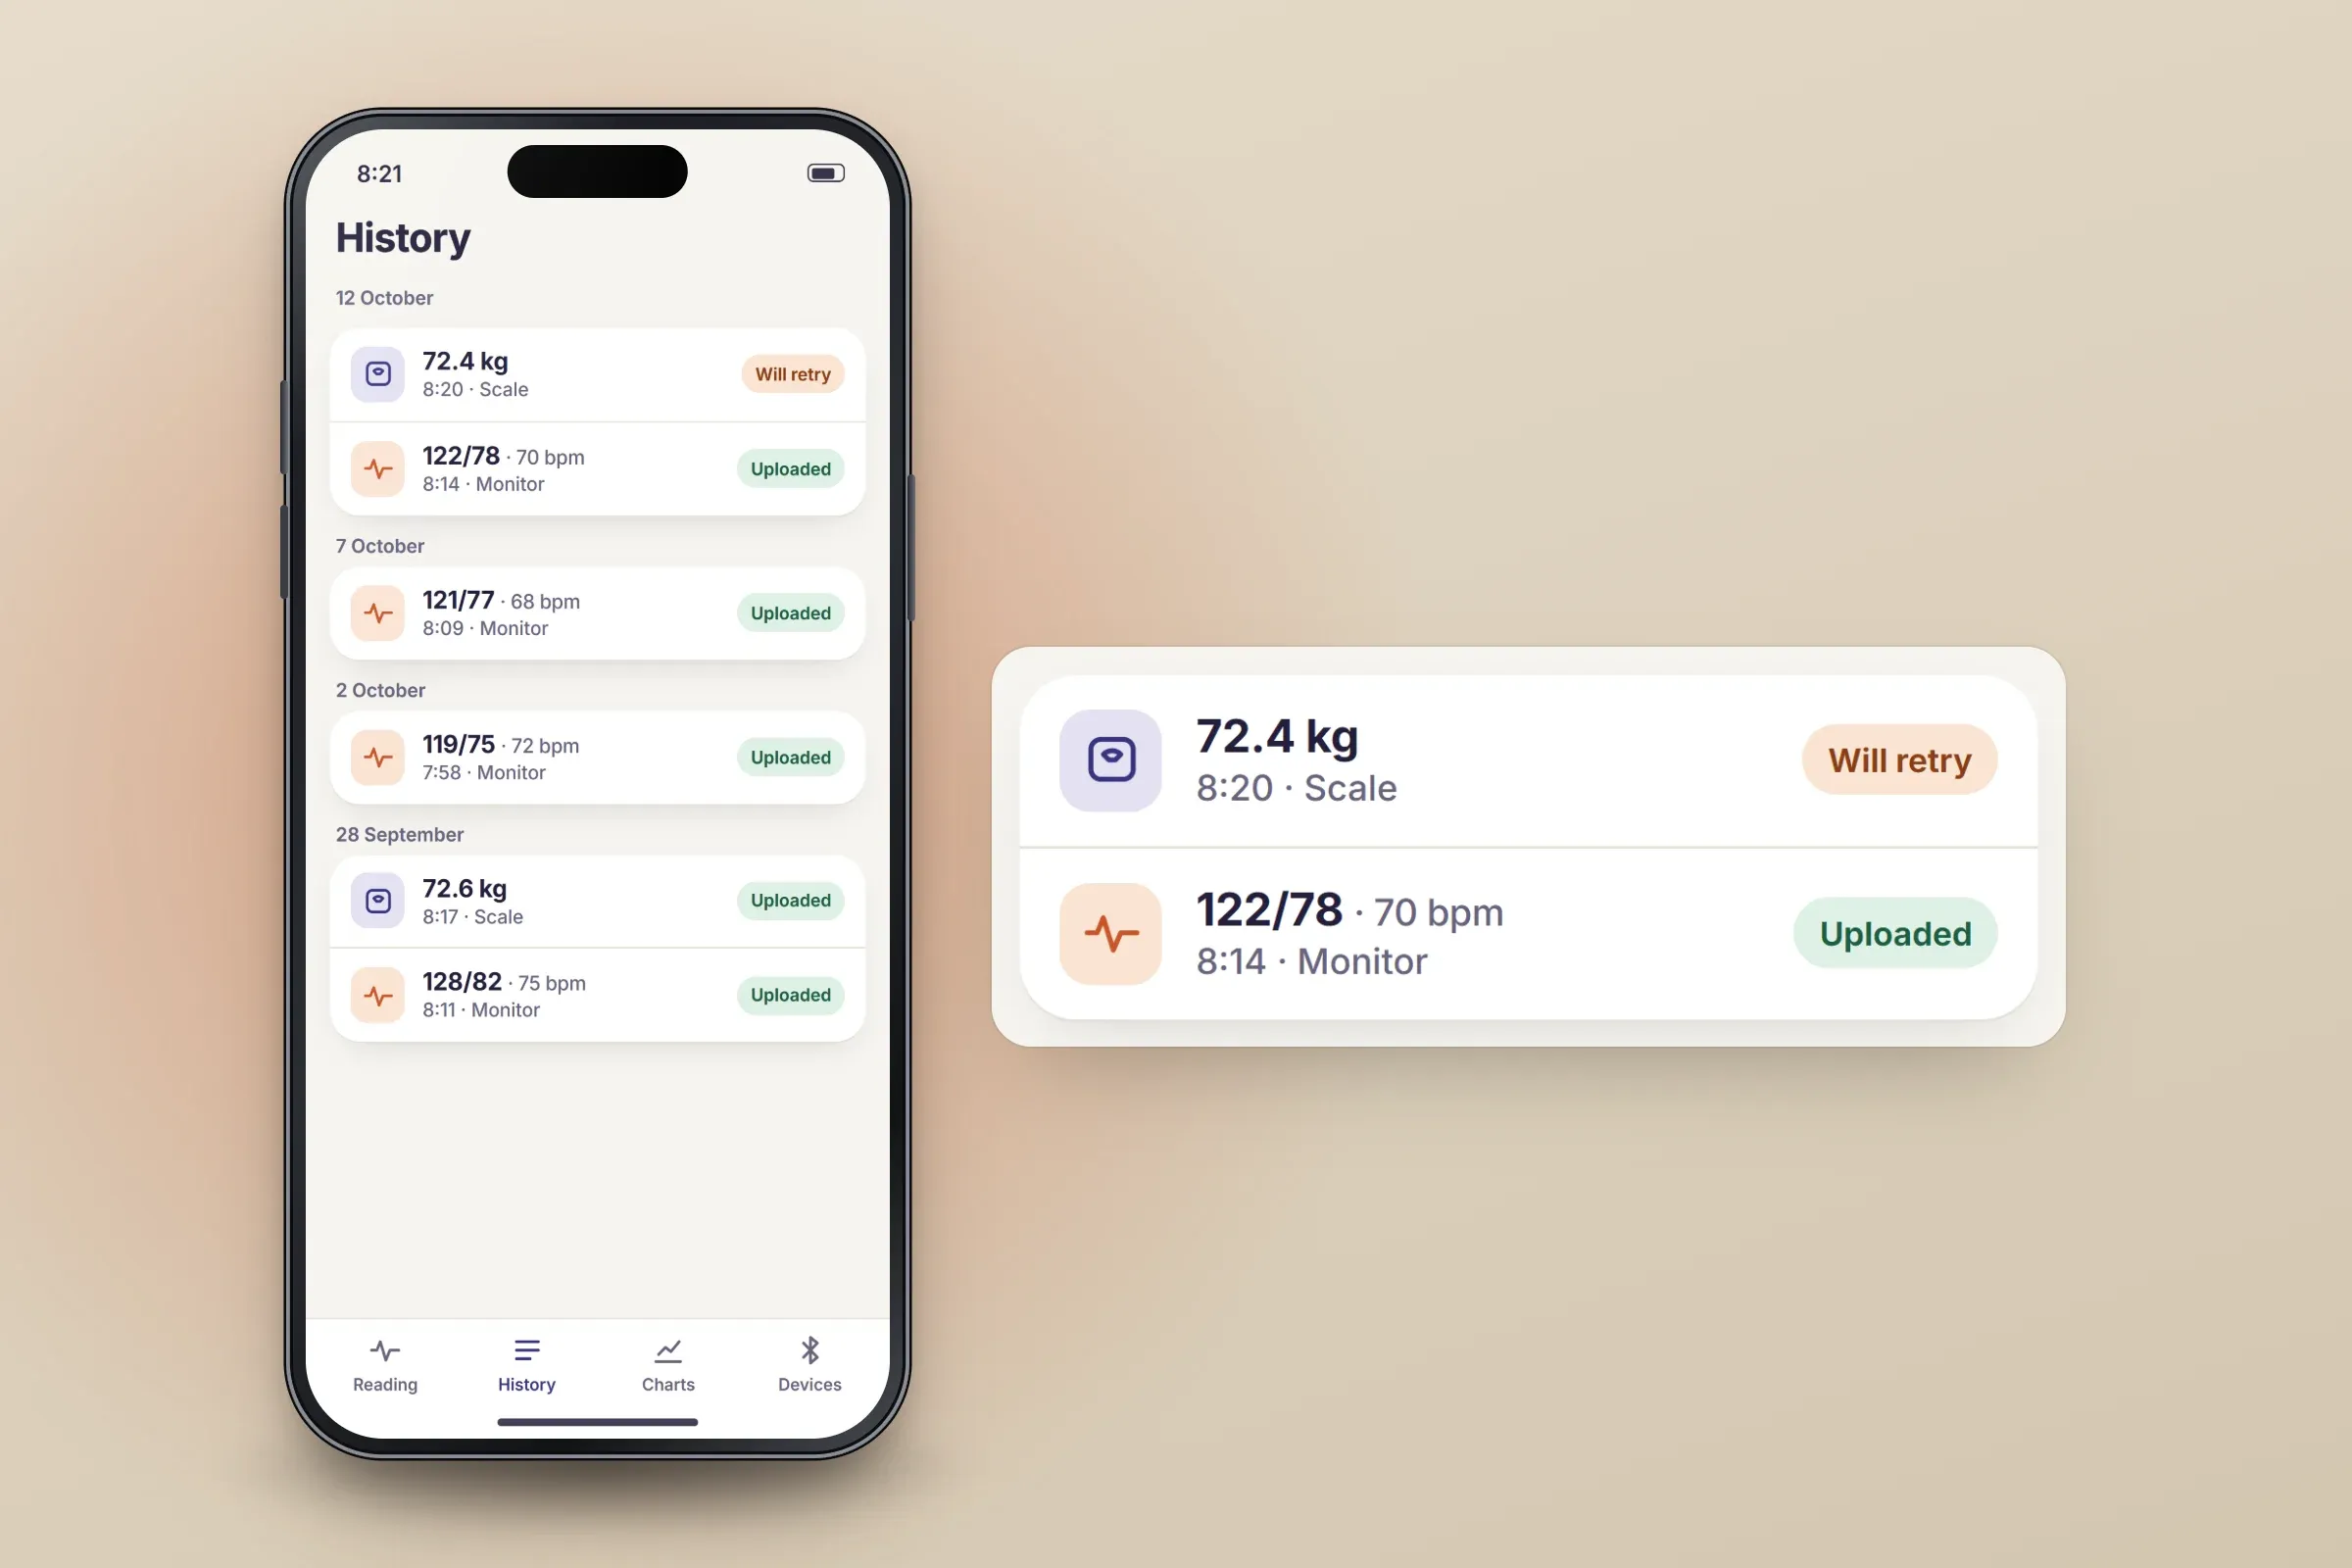
History with upload state. Close-ups on phones: tap any image for the full screen. Blood-pressure charts
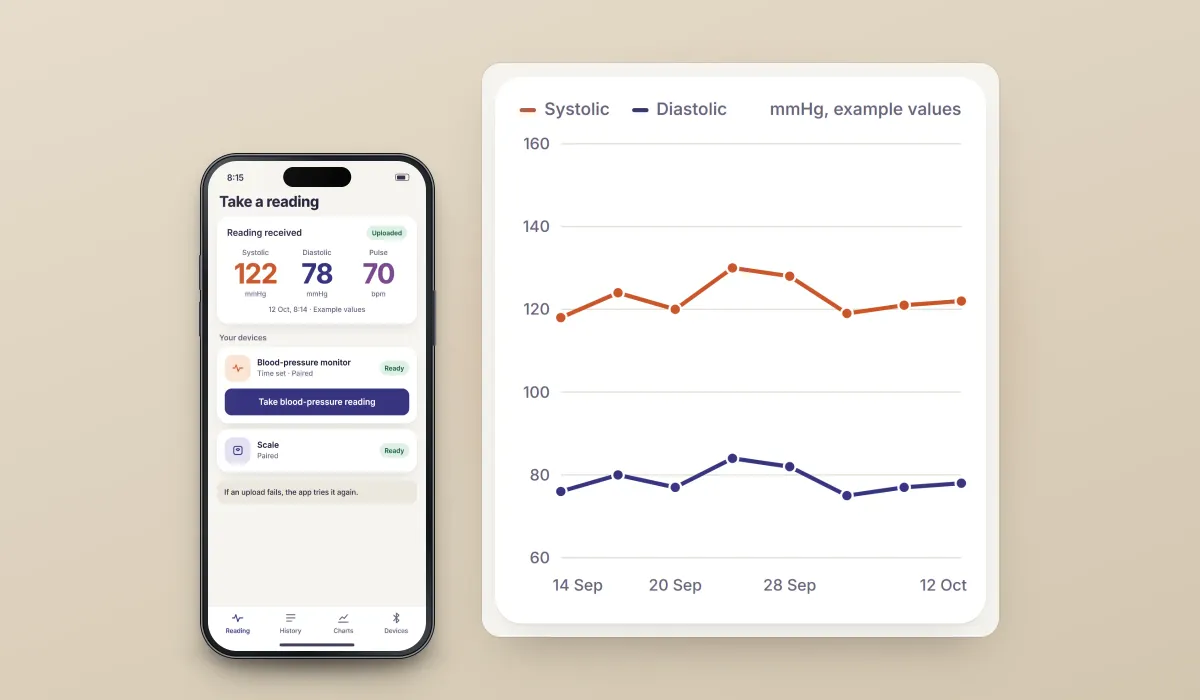
Charts plot the patient's blood-pressure readings over time.
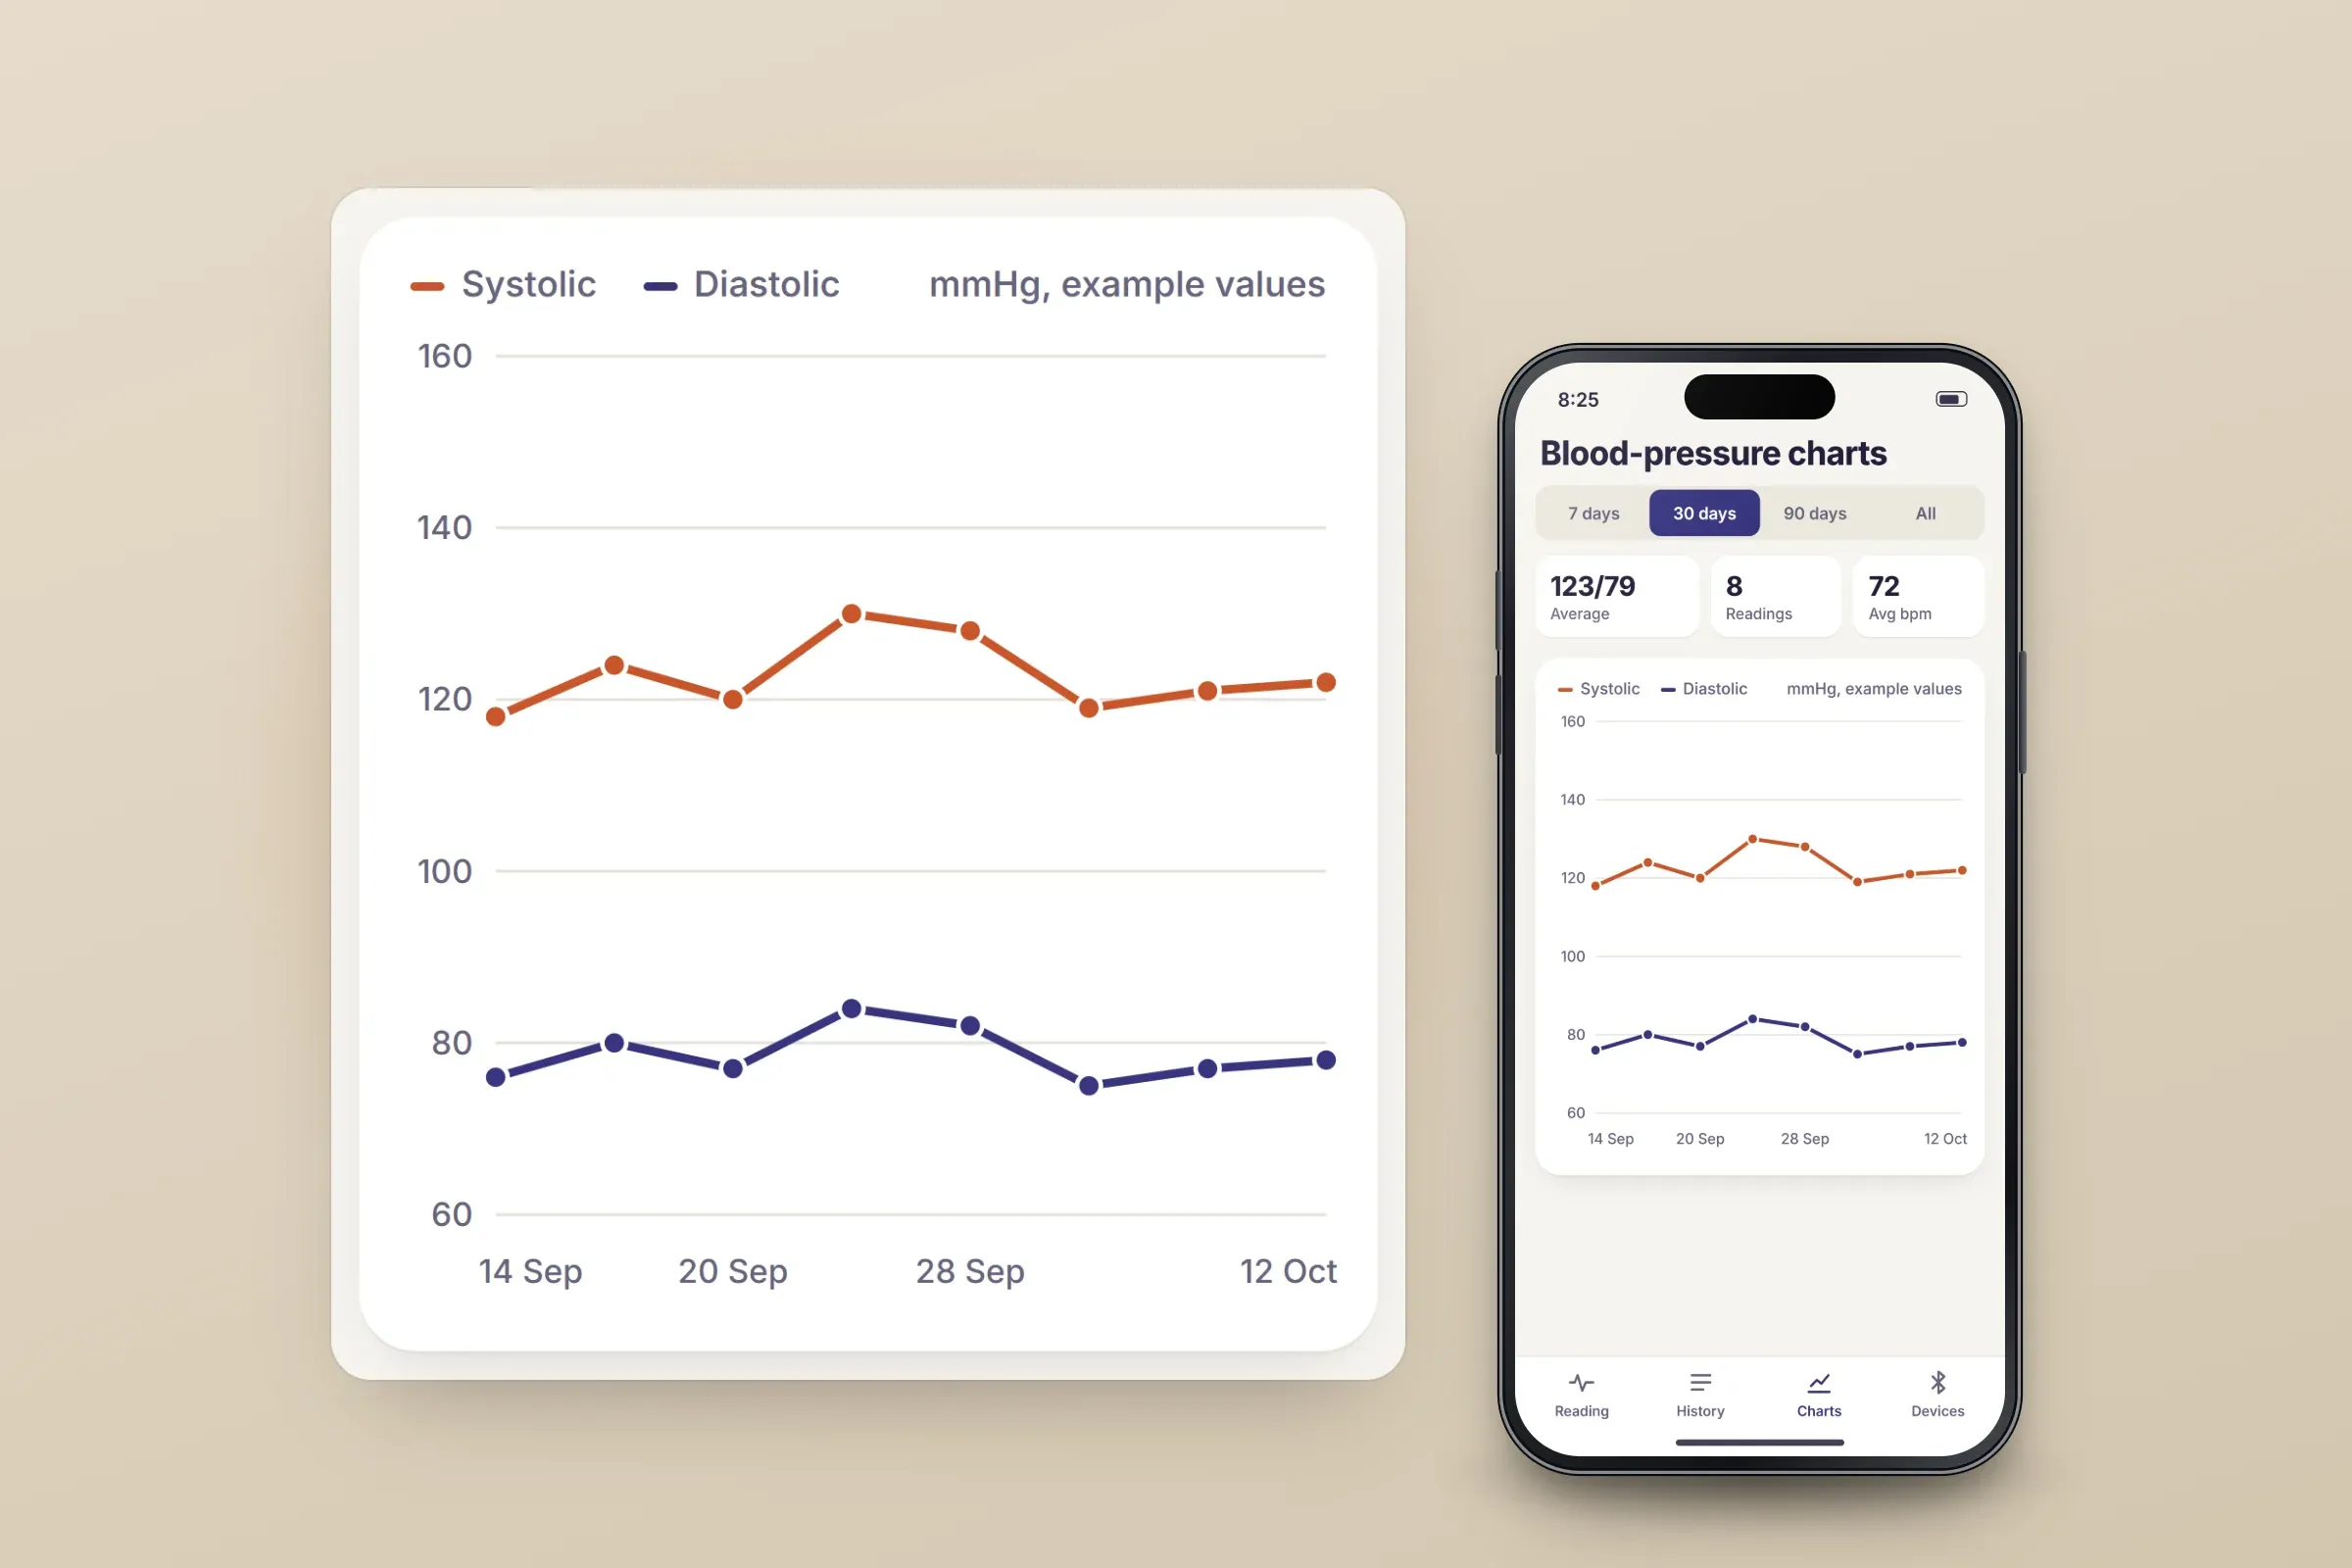
Thirty days of readings. Close-ups on phones: tap any image for the full screen.
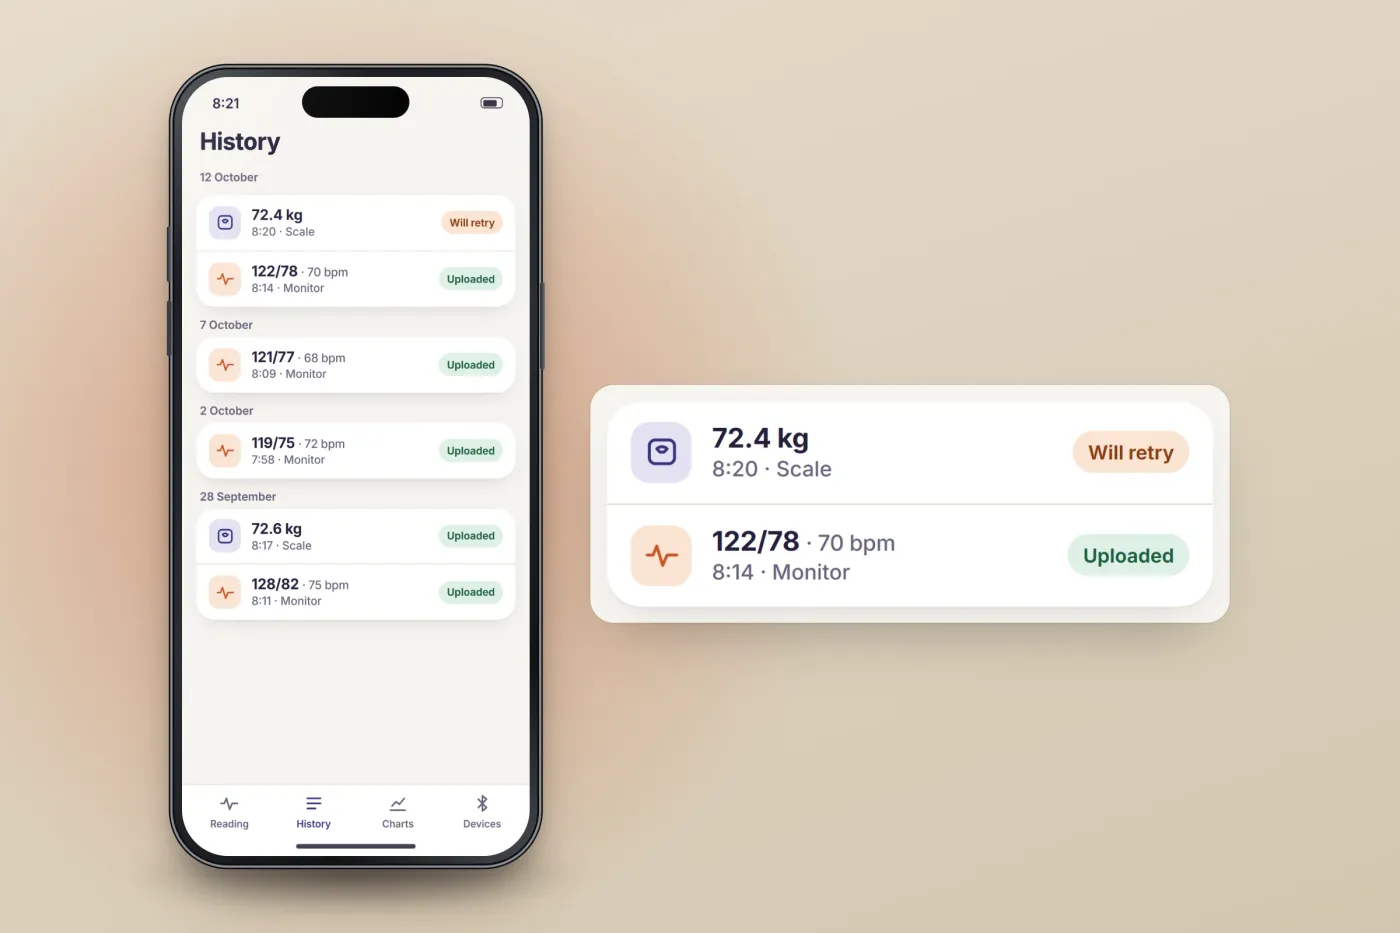
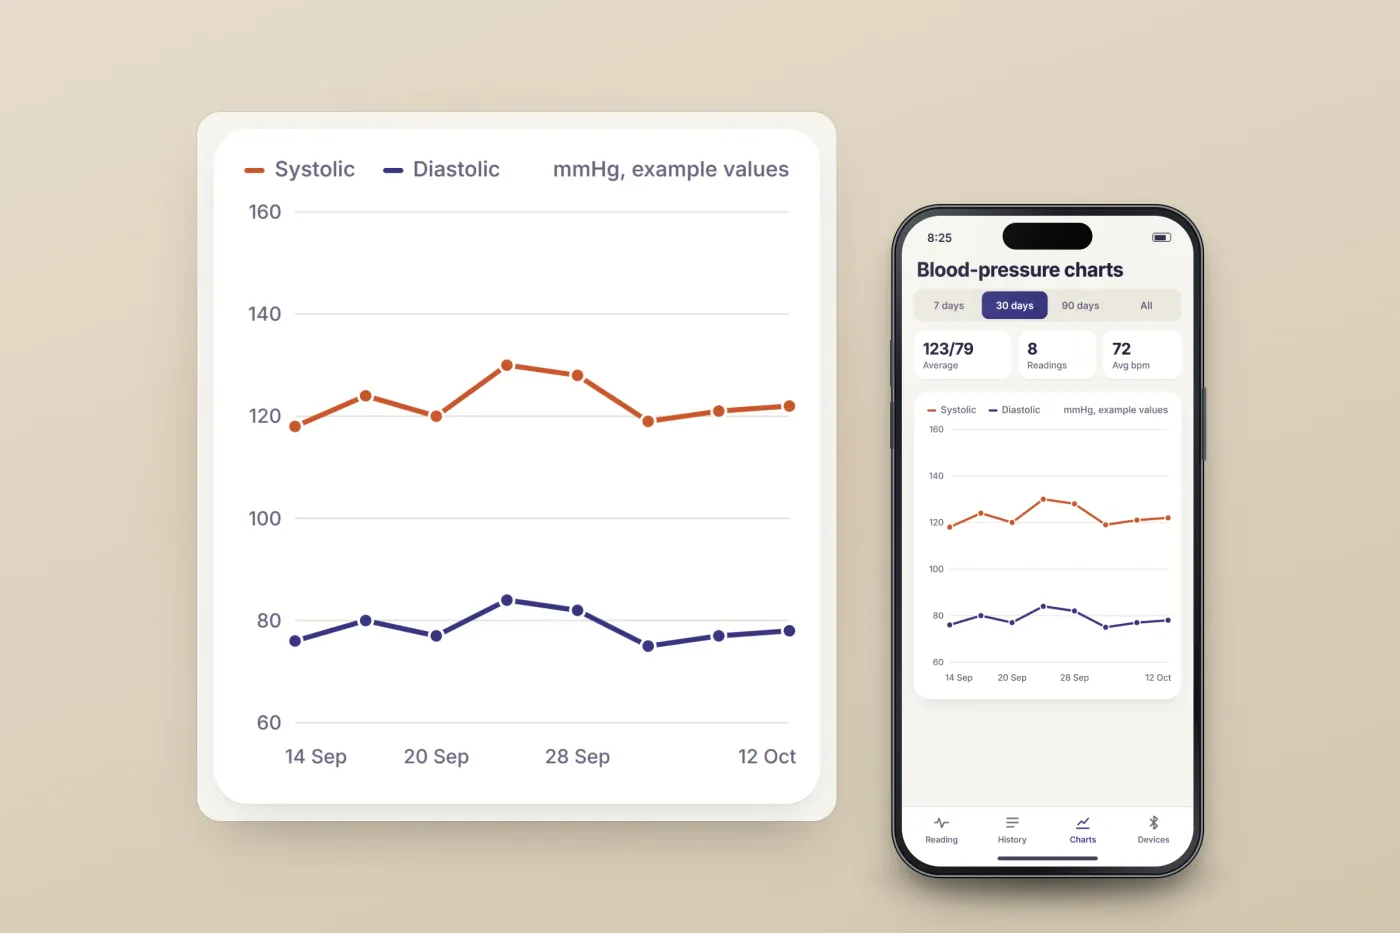
About these images: the screens are recreated for this case study, with neutral naming and example data in place of the client's brand, patients and devices, the layouts are illustrative, and they are not screenshots of the app. Every reading shown is an example value, not medical information or guidance. No real monitor or scale is pictured.
Delivery
The engagement
- Published on Google Play and the App Store.
- Built in 2026.
Related services
The services behind this project
- Flutter app development One Flutter codebase for iOS and Android: new apps, Bluetooth devices, native bridges, the back end behind them, and moving on from FlutterFlow.
- Apps for IoT and connected devices IoT app development for Bluetooth and Wi-Fi hardware — pairing, live sensor data, device control, sync and firmware updates from the app.